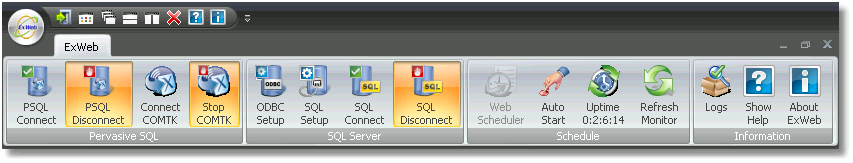
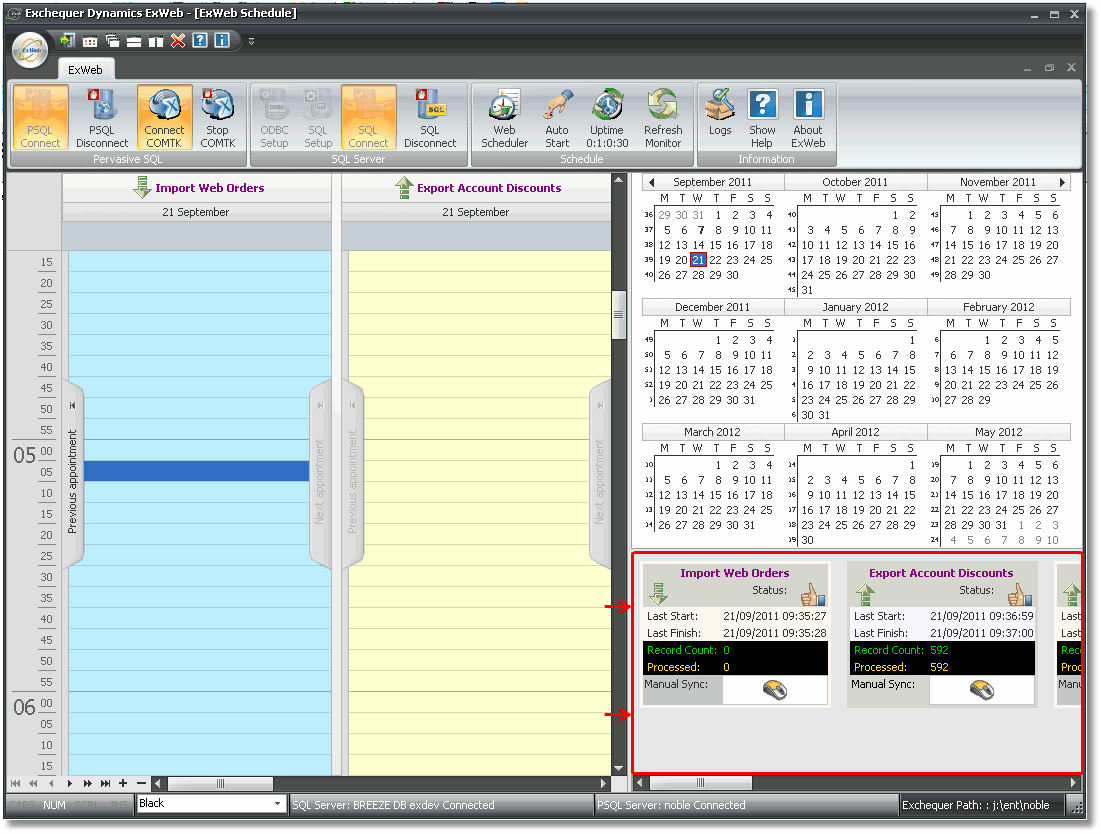
The main ribbon toolbar is located at the top of the ExWeb interface:
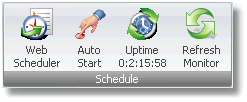
The next section of the toolbar is the 'Schedule' section:
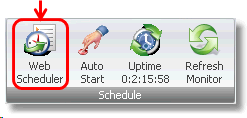
Once you have connected to SQL, PSQL and also connect the COM ToolKit, the Web Scheduler button will become active (selectable).
Note: If you have not connected all databases and the COM ToolKit, the Web Scheduler button will NOT work.
To open the ExWeb Scheduler simply click the Web Scheduler button:
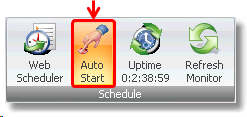
The next button in the 'Schedule' section of the toolbar is the Auto Start button.
Once you have successfully configured all SQL connections you can click this button to auto-start the connections and events upon reloading the application.
When you have clicked it will remain enabled until clicked again:
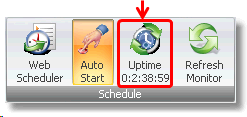
The next button on the toolbar was the Uptime button. This button doesn't actually have a predefined function, except for defining the time the application has been open.
This means you can see when ExWeb was last opened, which can explain as to why scheduled events are missed.
Clicking this button will simply open a window with the uptime:
The last button in this section of the toolbar is the Refresh Monitor button:
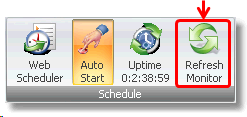
This button will refresh the monitor section of the ExWeb interface, shown below:
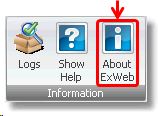
The next section of the toolbar is the information section:
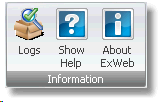
The first button will open the Event Logs for the scheduler:
Event log shows all scheduled events, from the past as well as future:
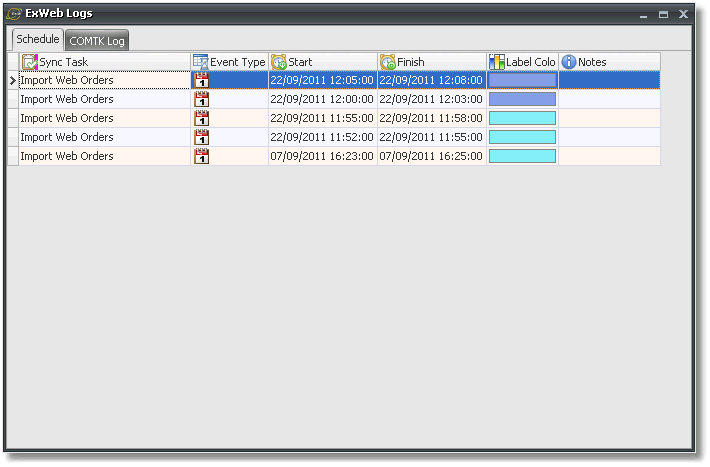
You can open up the configuration window for each event by double-clicking on it.
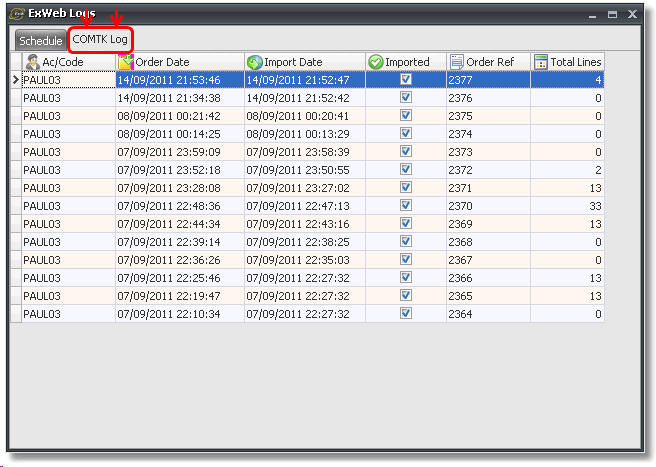
You can also look at the COM ToolKit log to see the individual orders come in.
To do this, click the COMTK Log tab at the top of the window:
The next button on the toolbar is the help button.
Clicking this button will open this help file:
The next button is the About ExWeb button.
This will open a window with information about ExWeb and its creators.
It provides the version of ExWeb installed as well as company information for Exchequer Dynamics: